Context
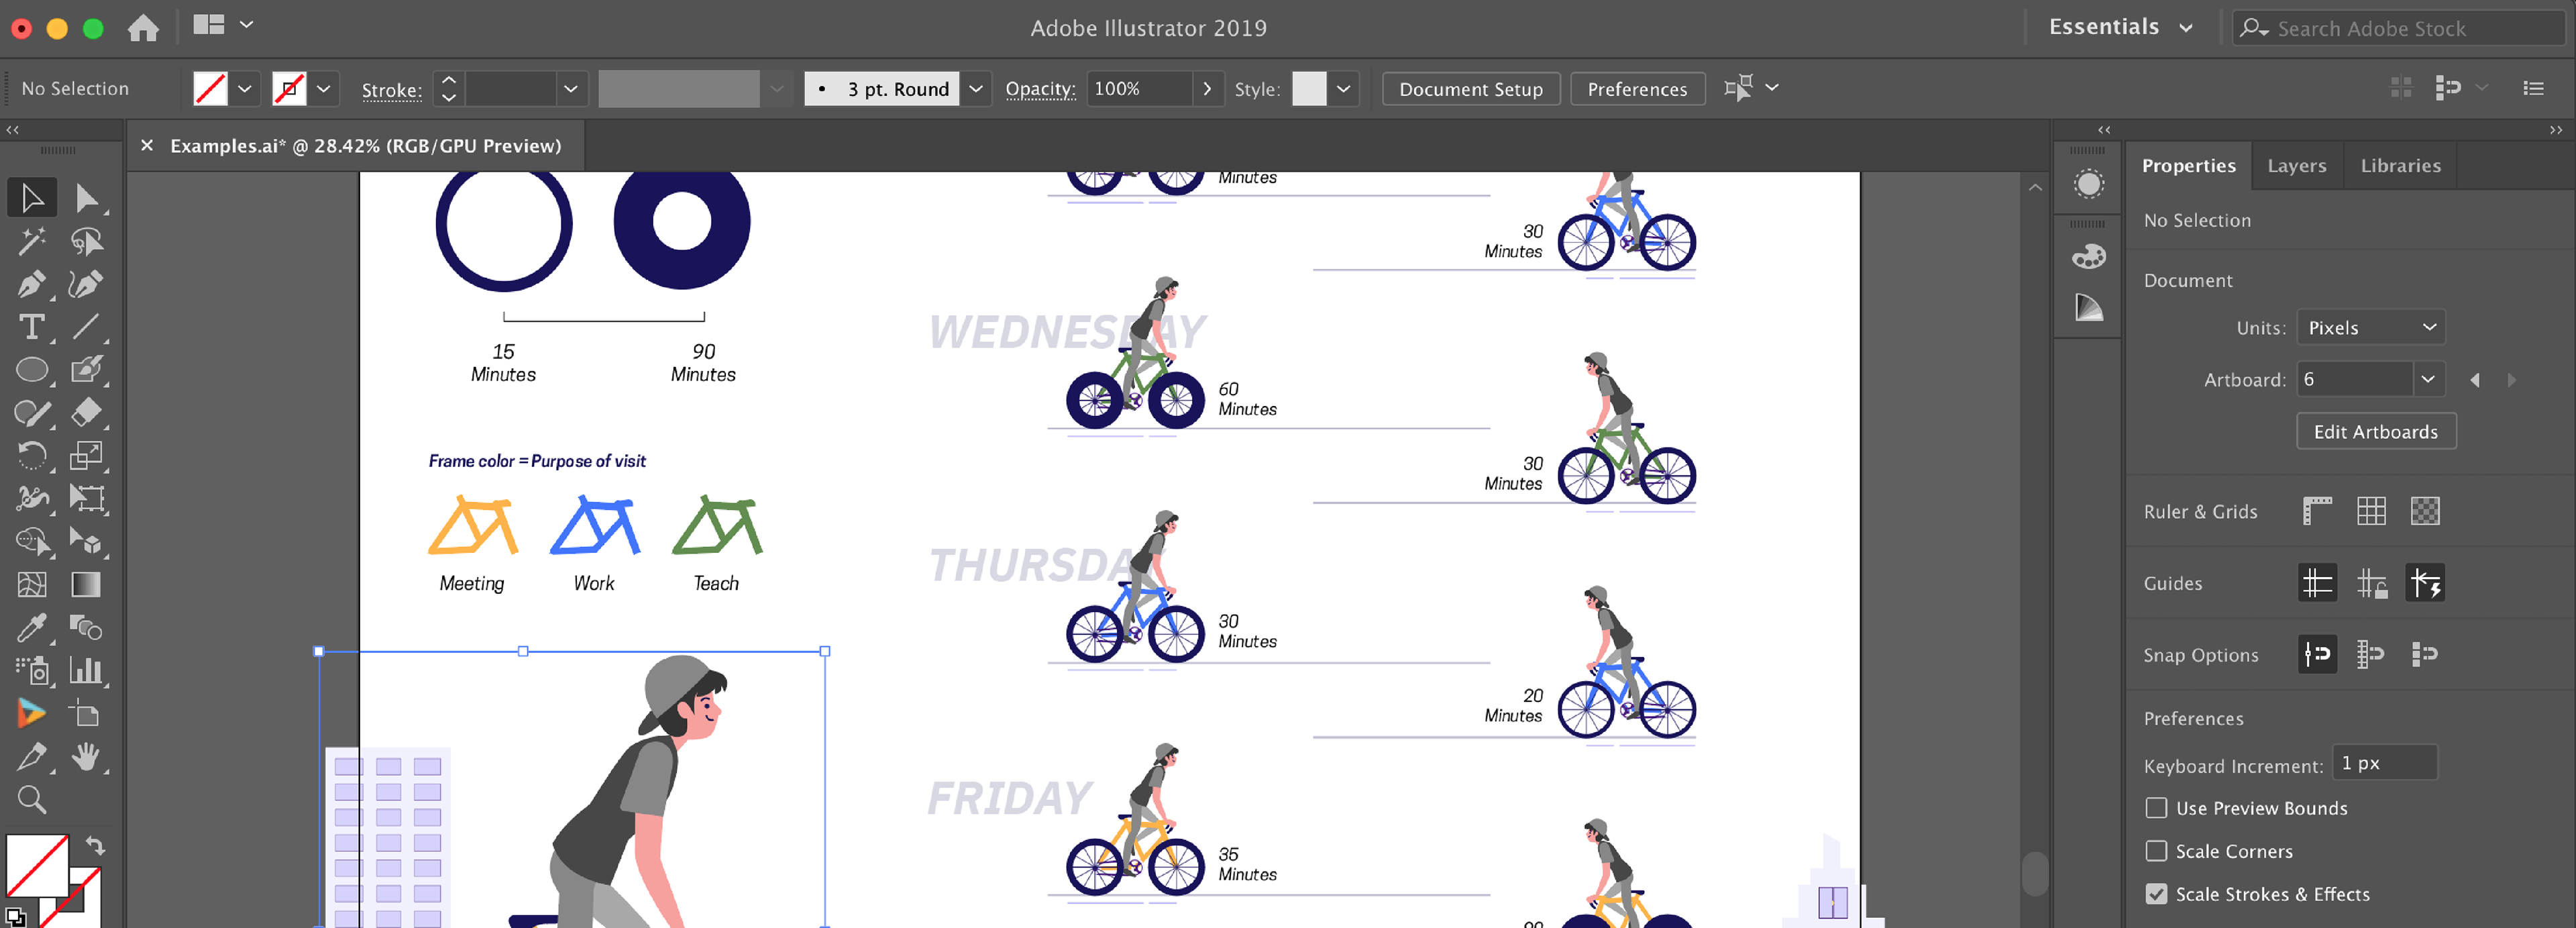
Adobe Illustrator is used to create a variety of digital and printed images, including cartoons, charts, diagrams, graphs, logos, and illustrations. Illustrator allows a user to import a photograph and use it as a guide to trace an object in the photograph. This can be used to re-color or create a sketch-like appearance of a photograph. Illustrator also makes it possible to manipulate text in many ways, making Illustrator a useful tool for creating postcards, posters, and other visual designs which use text and images together.
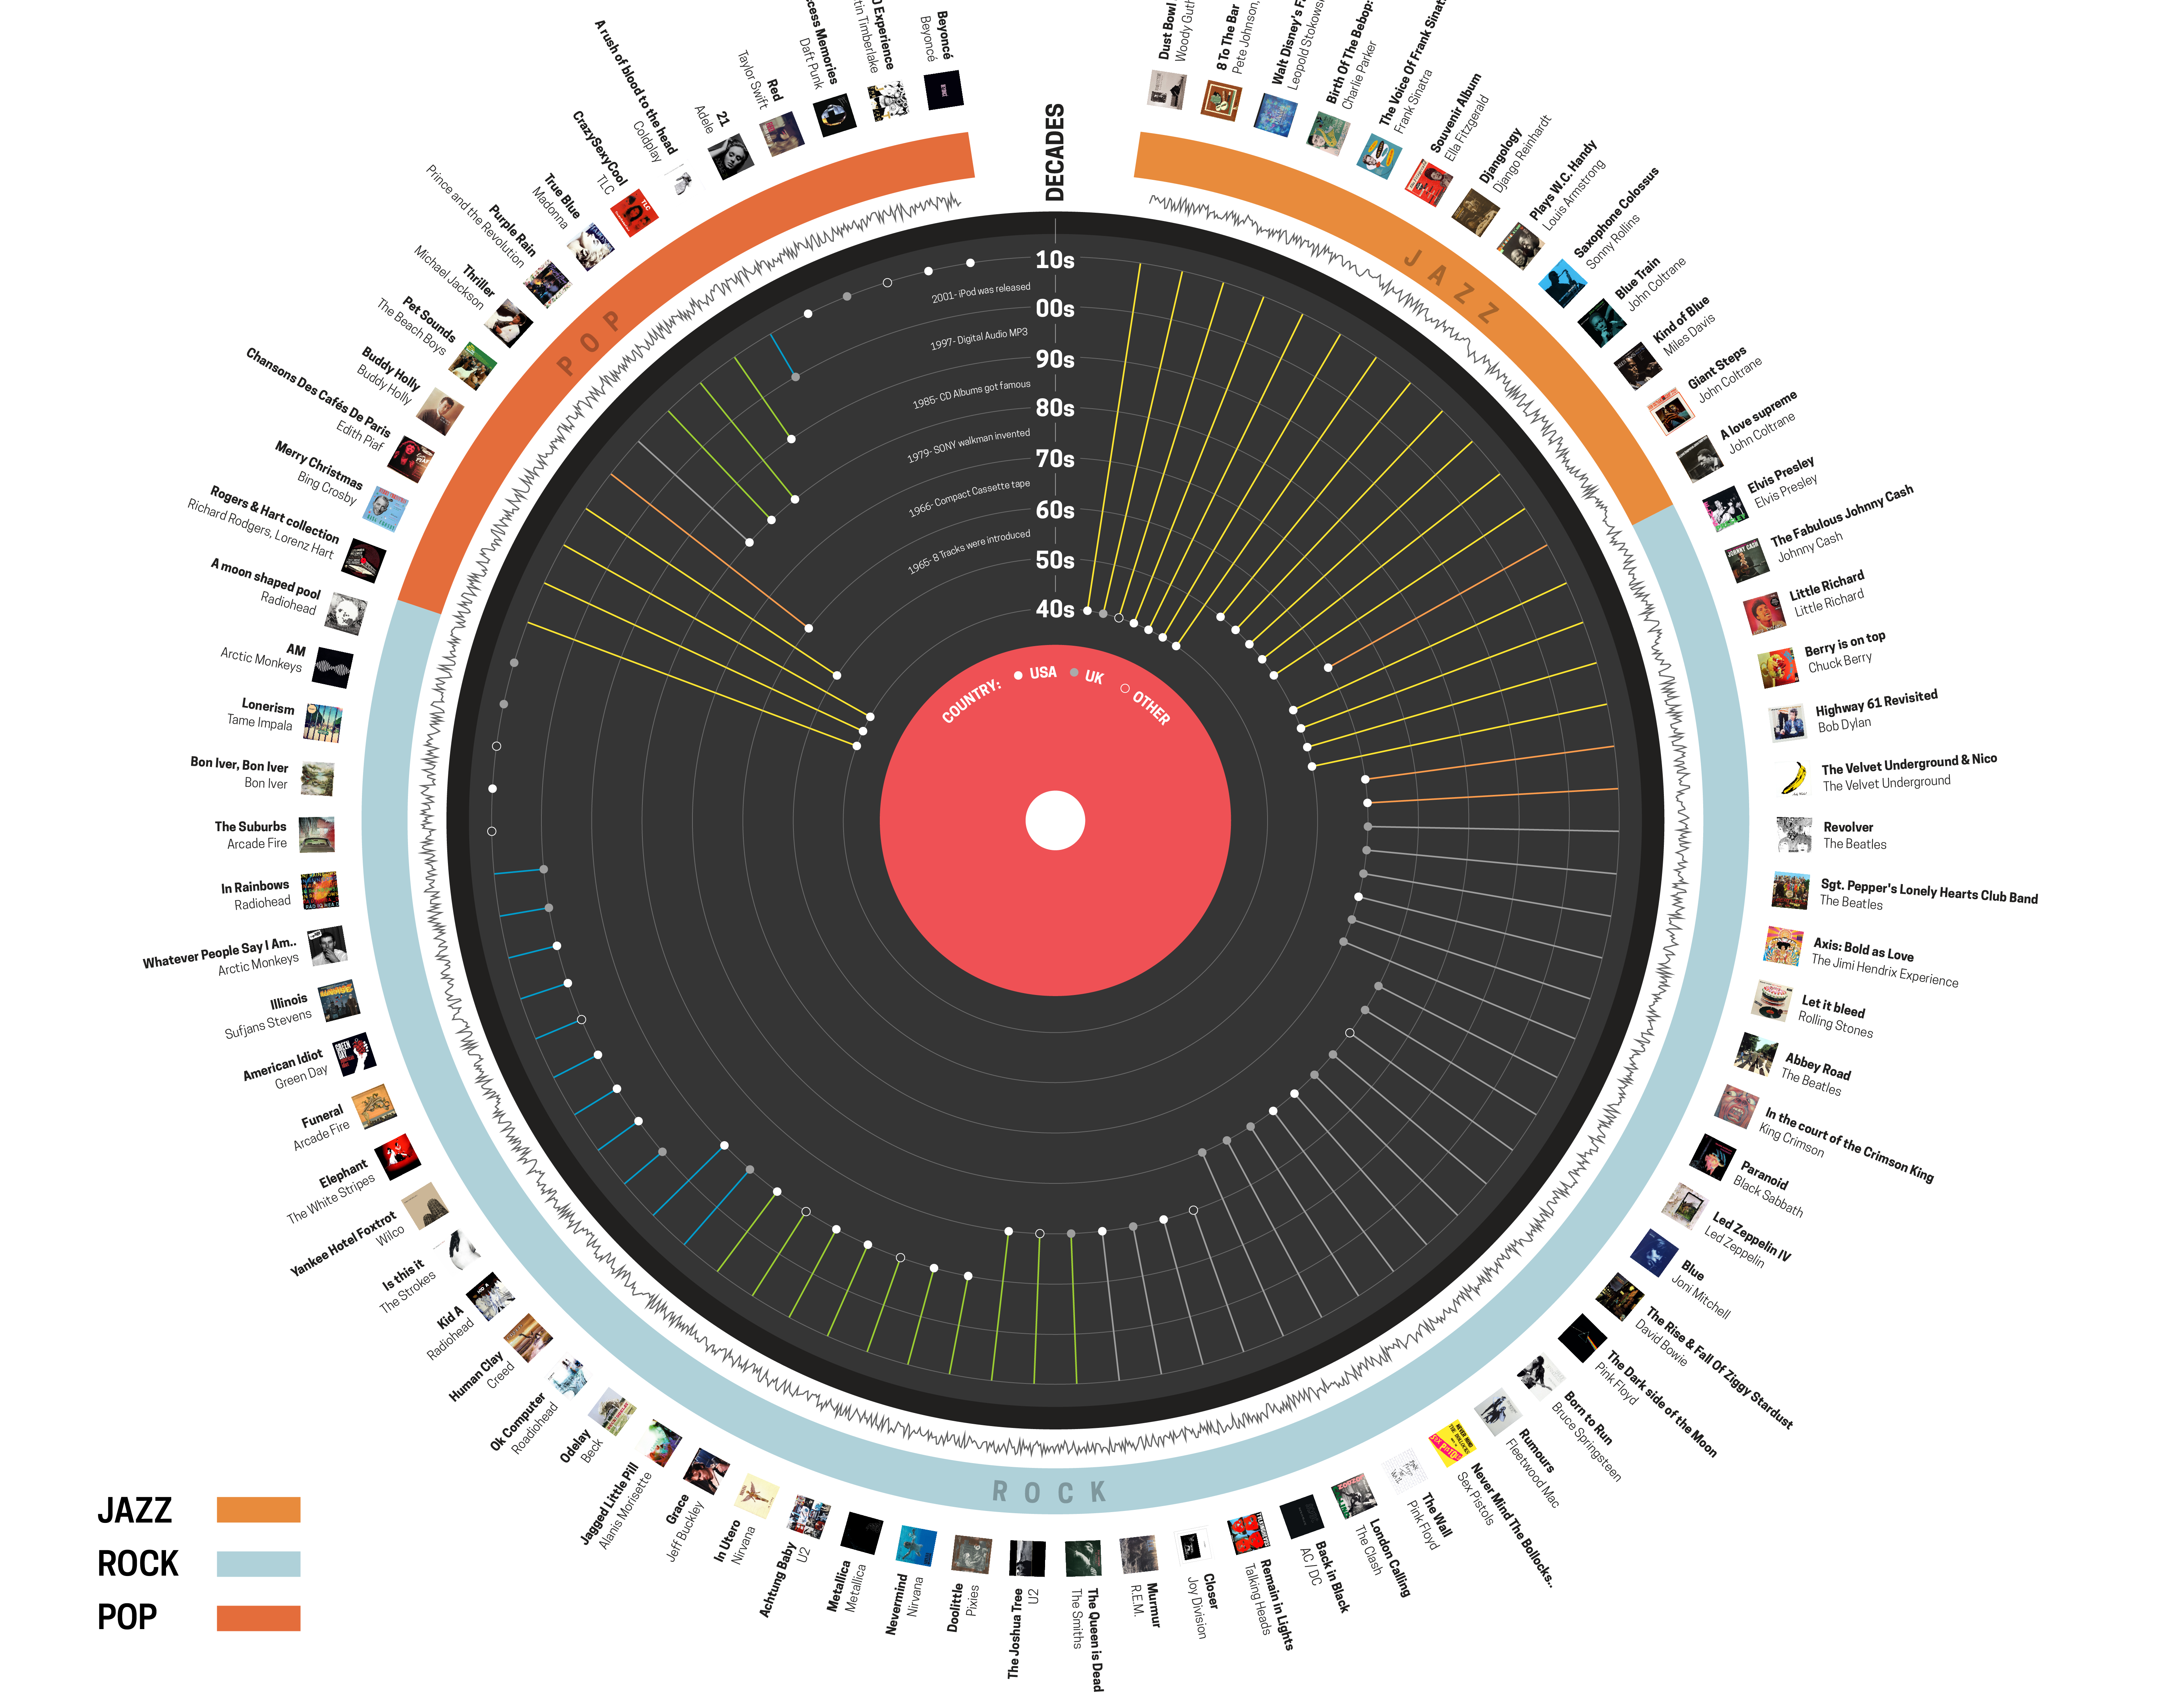
Illustrator is also used by designers to create Information Graphics which are published for web and print.
Focus of the project
Information Design is the practice of presenting Information in a way that makes it most accessible and easily understood by the end users. As designers, the Information Graphics are focused to be visually rich.
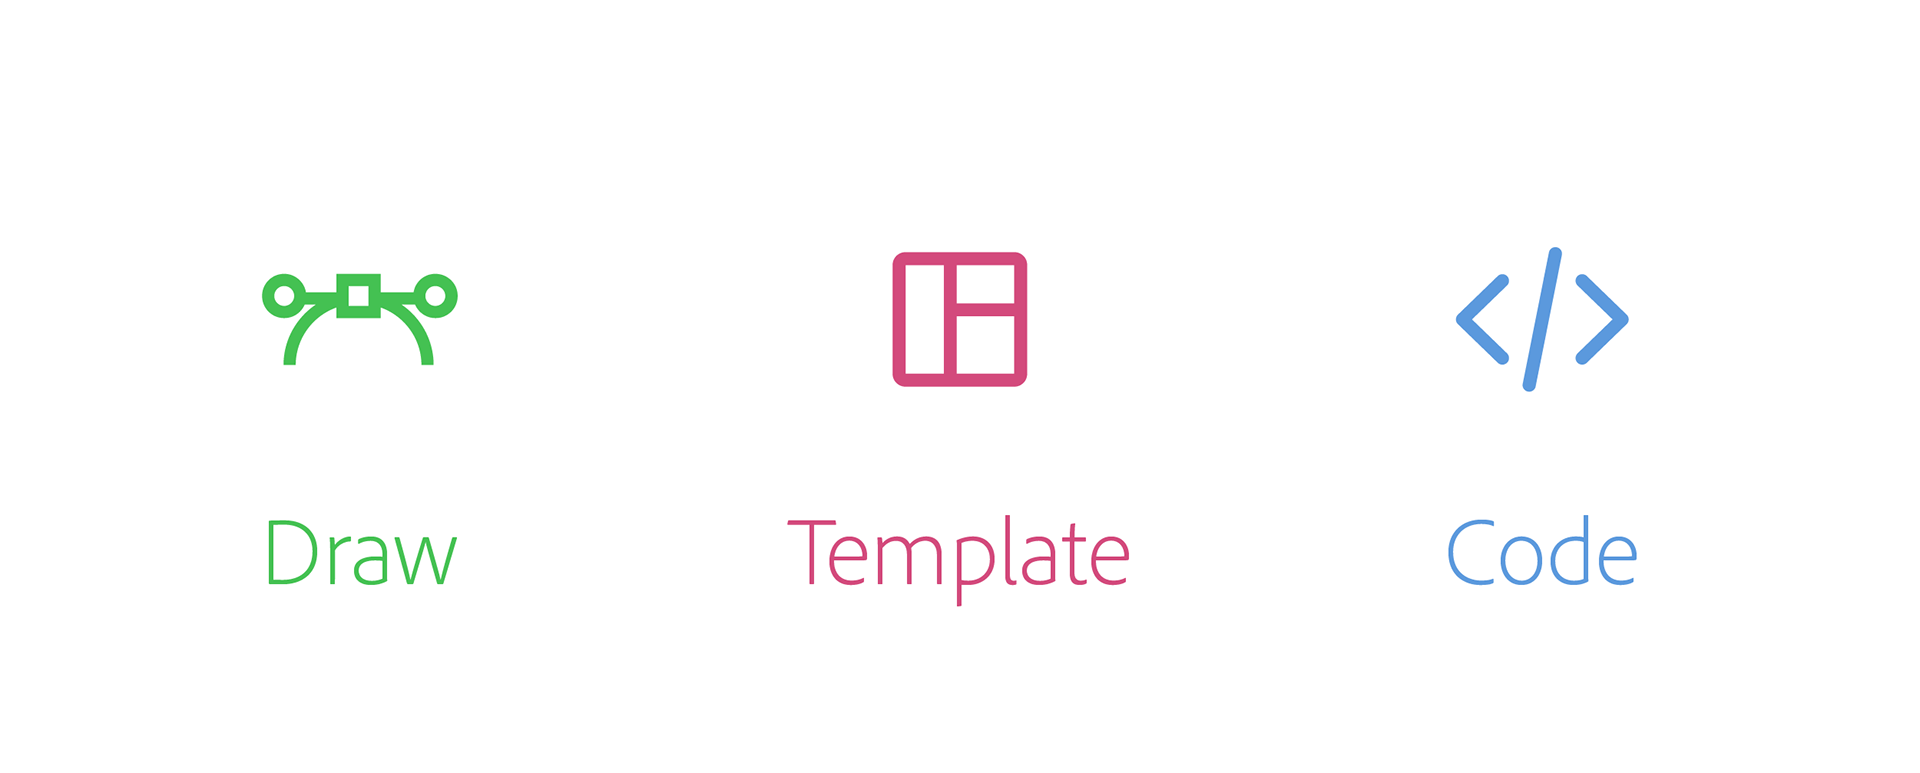
There are three ways to design Information Graphics.
One: Draw it from scratch using creative applications like Illustrator.
Two: Use a template tool like Tableau.
Three: Creating using code & programming languages.
One: Draw it from scratch using creative applications like Illustrator.
Two: Use a template tool like Tableau.
Three: Creating using code & programming languages.
Creating Information Graphics in Adobe Illustrator is a complex & time-consuming process as the user needs to draw each and every element from scratch.
Importance of the project
Creating Infographics and Data visualisation is a $4bn market growing fast. There is a large number of designers that professionally work on creating Infographics as part of their daily job. But creating good infographics is extremely challenging. Adobe wants to better its products in the field of data visualisation in the future.
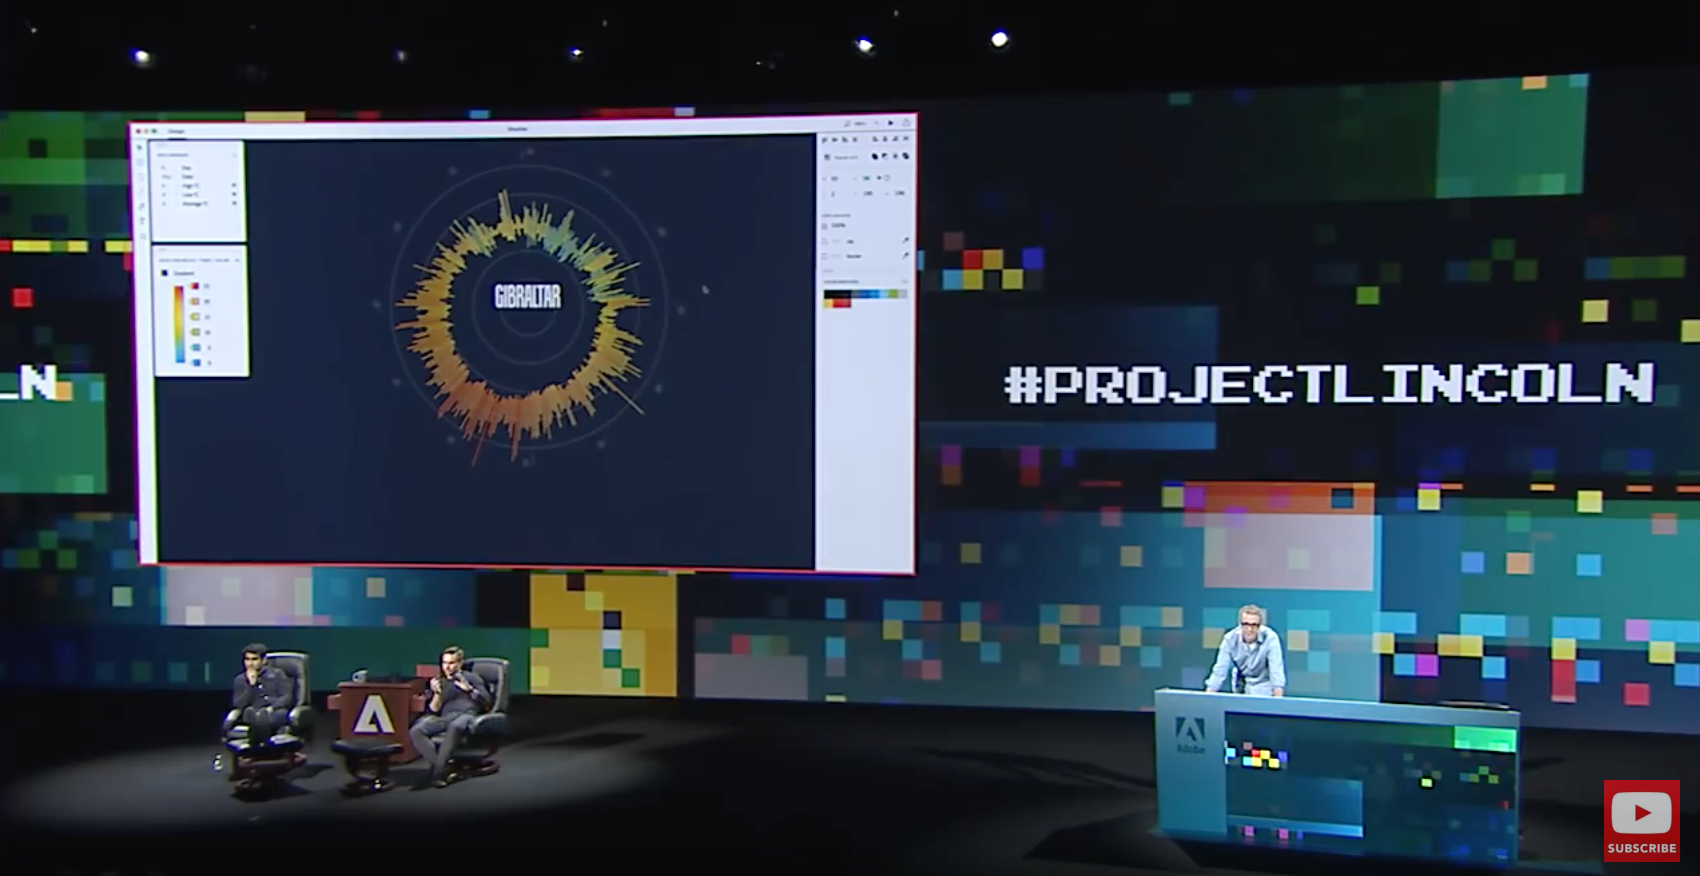
Project Lincoln, which was first proposed in 2017 in Adobe MAX, awestruck every designer to imagine creating data visualization effectively.
Experience Designer Bernard Kerr presented a demo where he makes 14 visualizations in under 4 minutes. Adobe has also collaborated with the Georgia Institute of Technology to develop an online tool called Data Illustrator.
This opened up the scope for creating a better concept and exploring different options for creating Information Visualisations.
Objective
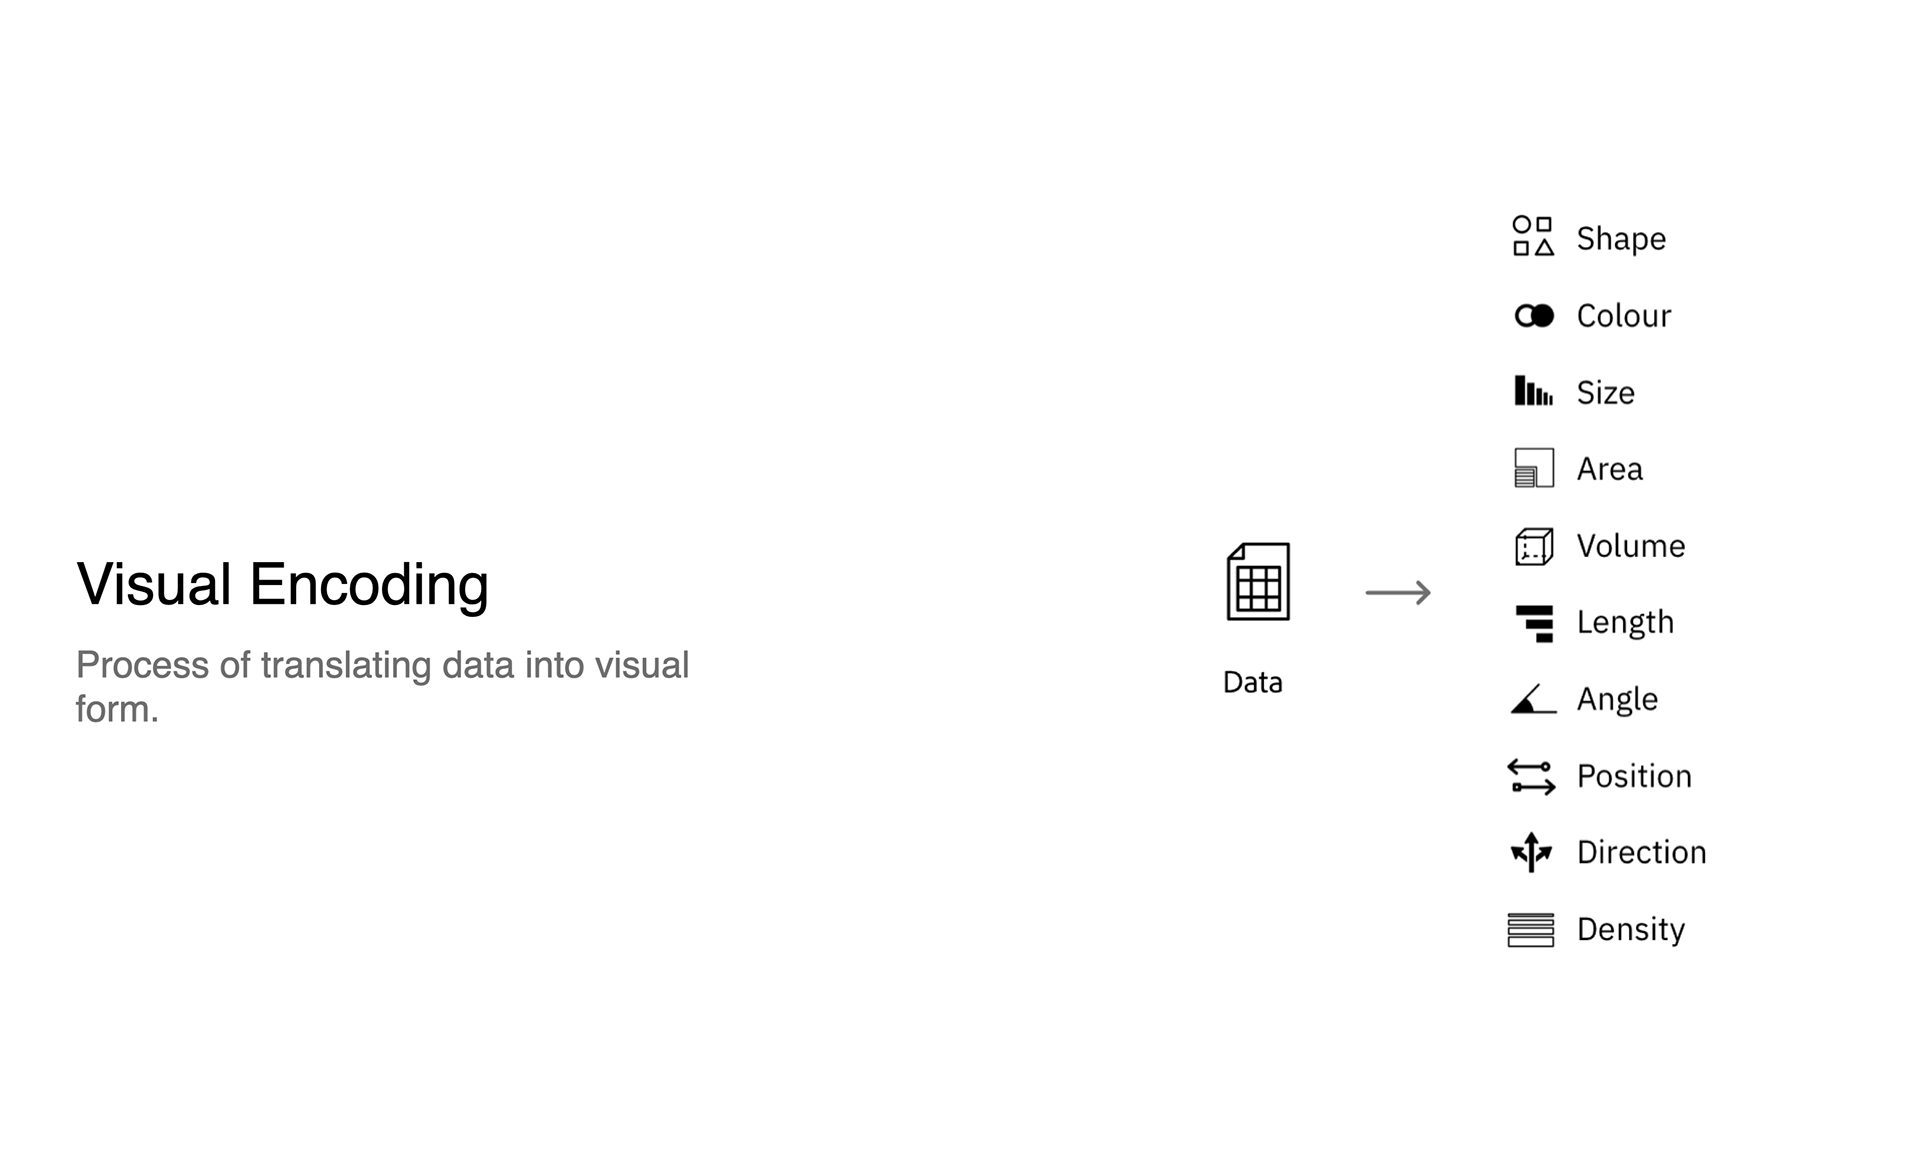
The primary objective of this project is to create workflows that could either be a feature in-built into Adobe Illustrator or a plug-in or an independent concept that could be integrated with other applications. I have used the principles of Visual encoding to map data to the visuals to create a POC.
As an Information & User Experience Designer, I have used the principles of visual encoding to bind data to the visuals and follow the process of UX Research by understanding the existing tools, conducting user interviews, and ideating with demos in an agile process within a span of 6 months.
Archived Ideas: Guides to automate visual properties over the change in data.
Archived Ideas: Generative visuals as components using MVC (Model, View, Controller) Framework
You can find the case study below. Though most of the final work is as Video Prototypes which can be shown during portfolio presentation