Background:
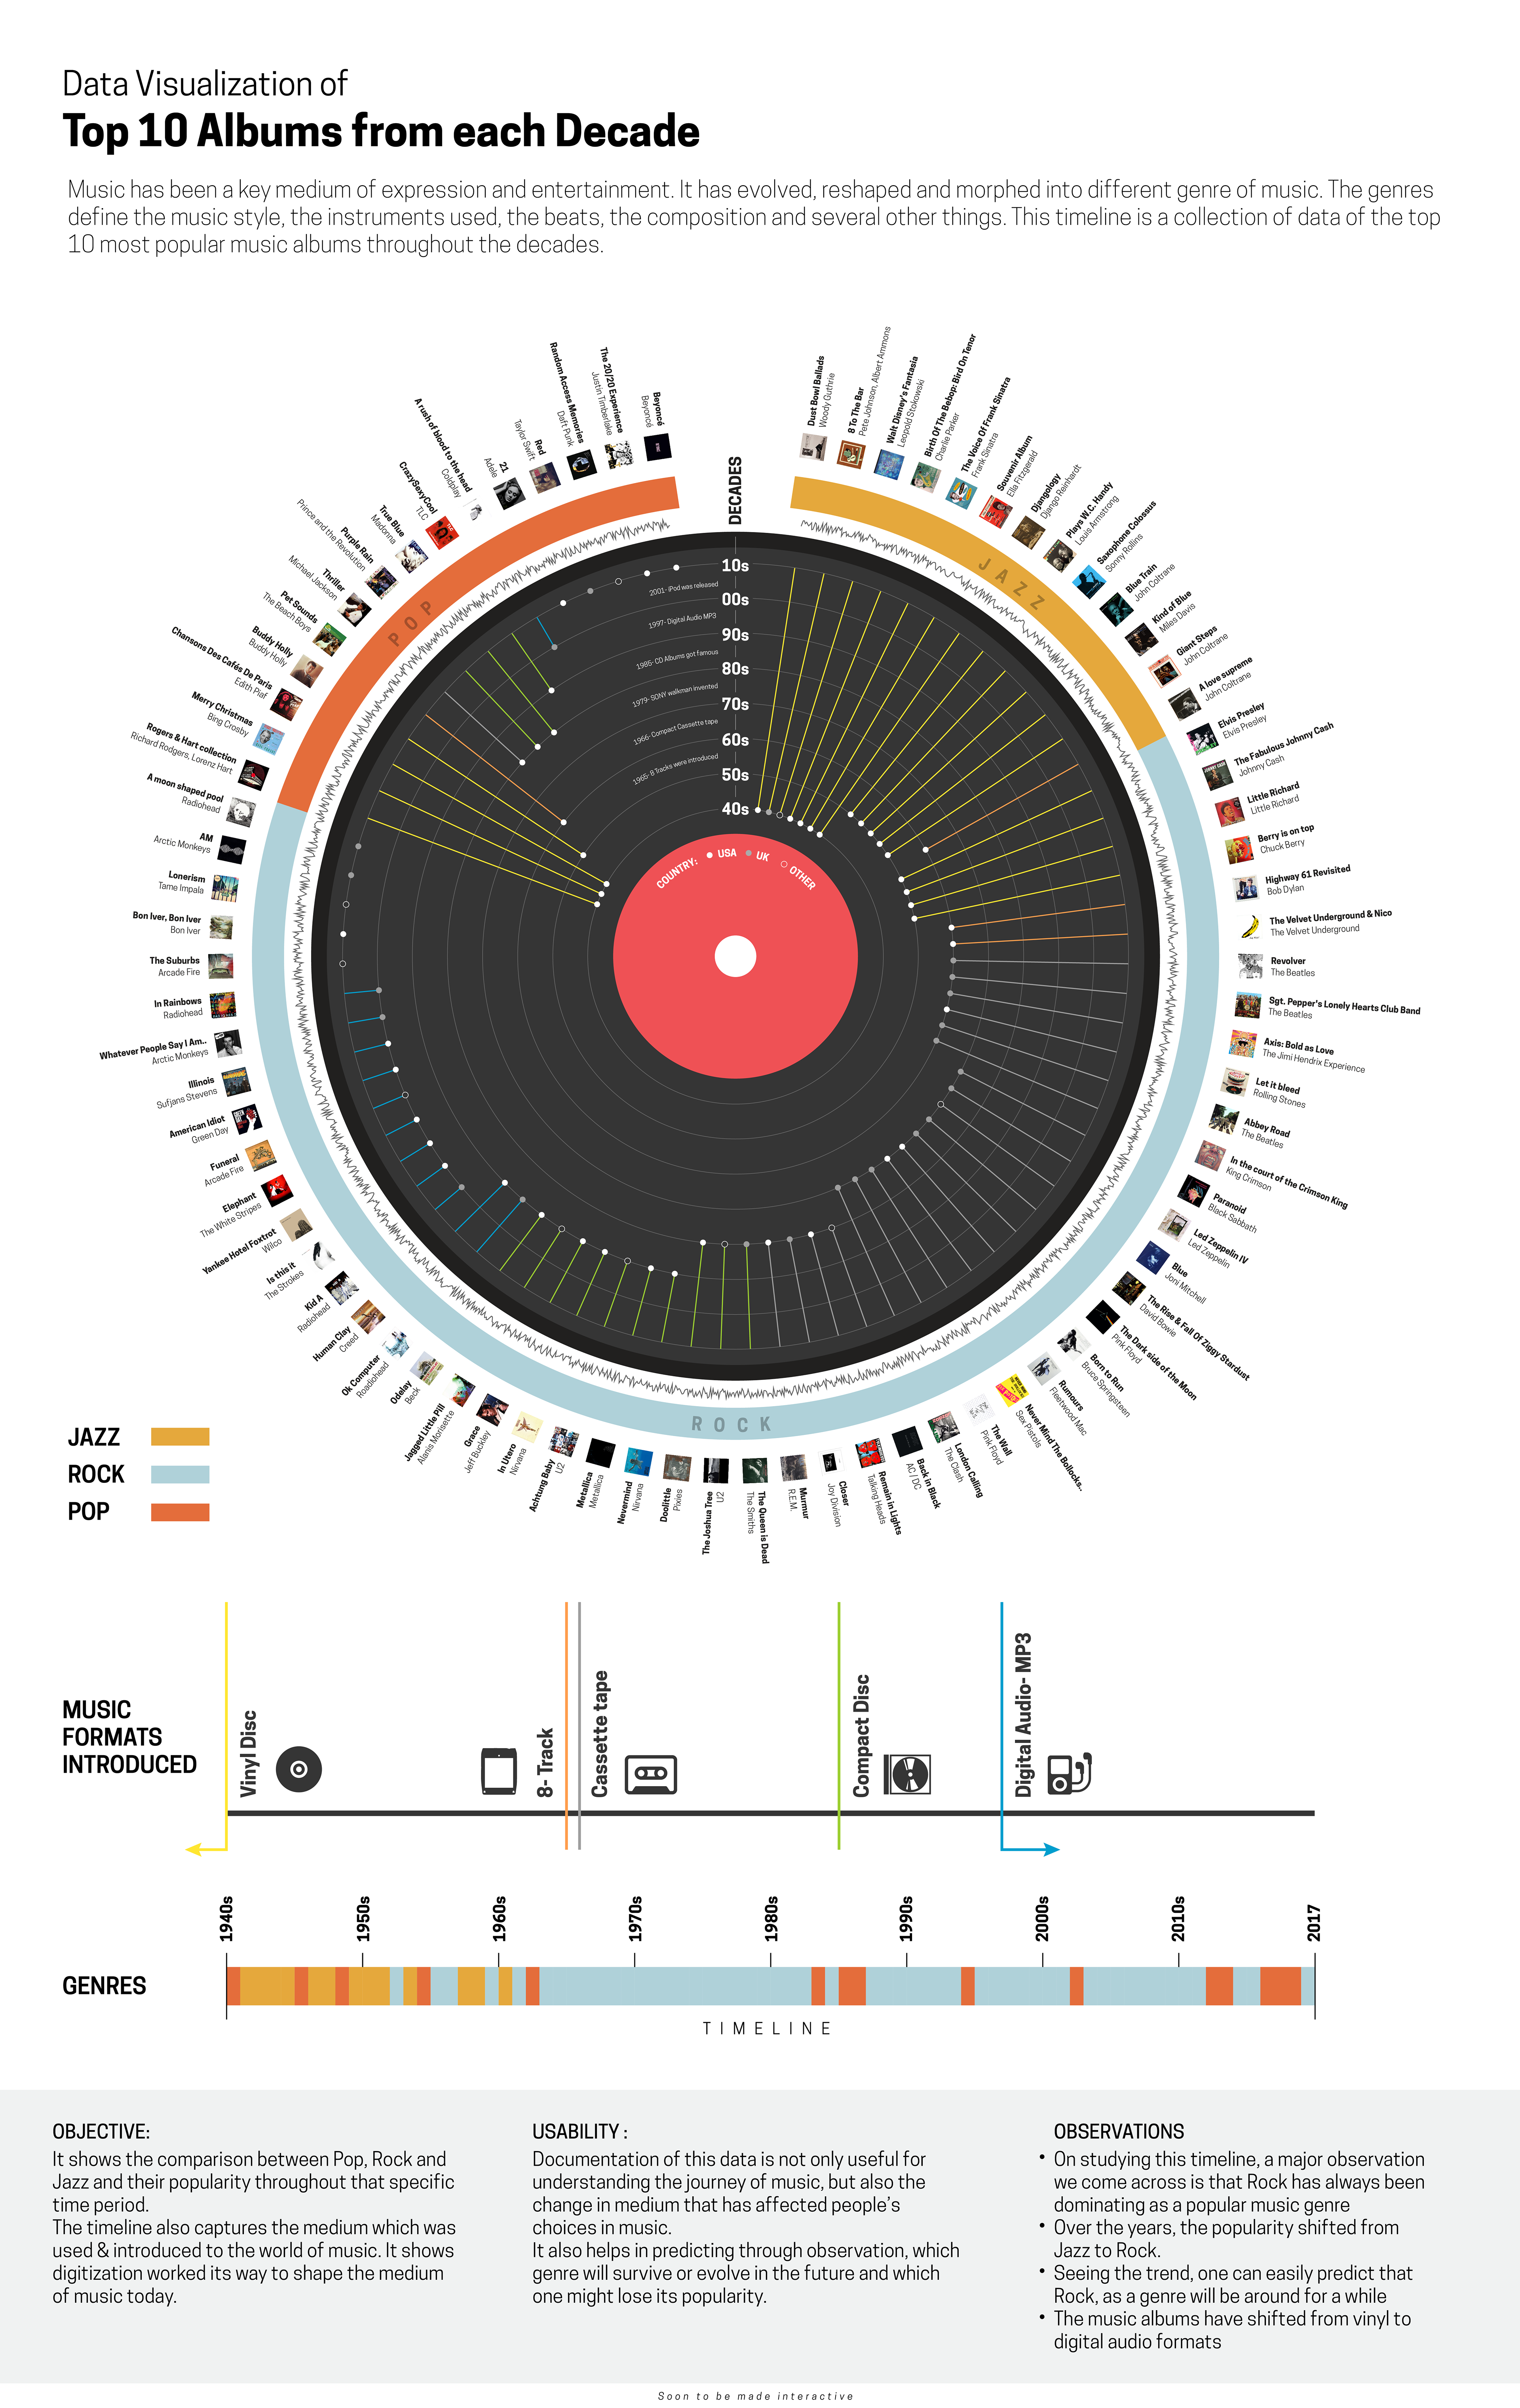
This visualisation was created in 2017 as part of the academic course at NID Semester 1 under the guidance of Prof. Charadhar Saswade. It was a one-week module, where students learned the history of visualisations from the past. As a deliverable, we were allowed to pick a topic of choice and create visualisation based on the timeline from history. I picked up music as the topic and narrowed it down to crafting a data visualisation for specific different genres over different decades.
This visualisation was created in 2017 as part of the academic course at NID Semester 1 under the guidance of Prof. Charadhar Saswade. It was a one-week module, where students learned the history of visualisations from the past. As a deliverable, we were allowed to pick a topic of choice and create visualisation based on the timeline from history. I picked up music as the topic and narrowed it down to crafting a data visualisation for specific different genres over different decades.